
How to Track Progress on Your Client Project Dashboard
.jpg)
Build with Retainr
Sell your products and services, manage clients, orders, payments, automate your client onboarding and management with your own branded web application.
Get Started1. How can I track progress on my client project dashboard?
Understanding the Main Function of a Client Project Dashboard
Tracking progress on your client project dashboard is quite straightforward and involves understanding the primary features of the dashboard. Firstly, the dashboard is designed to display key performance indicators (KPIs) related to your project, like completion percentage, spent hours, and remaining budget. Secondly, it provides an easy-to-interpret visual representation of these data points, allowing for quick status checks. Lastly, it enables real-time monitoring due to its connection to the project data source.
Examining the Dashboard Elements
The primary elements you should pay attention to while tracking progress are tasks, milestones, and resources. For tasks, they are usually displayed in a Gantt chart for easy visualization. On this chart, each bar represents a task, and their lengths correspond to the duration. For milestones, they are represented as diamonds or special markers on the Gantt chart, indicating significant events or achievements. Lastly, resources refer to the people assigned to tasks. Their names are usually displayed next to the corresponding task bars.
Interpreting the Dashboard Data
To interpret the data, here's a guide:Also, check updates on the dashboard regularly bearing in mind that:
- Scope: To track the project scope, check the total number of tasks and milestones on the Gantt chart and compare this to your project plan.
- Schedule: To assess your project schedule, look at the start and end dates of tasks and milestones and compare this to your project timeline. Check for any delays or ahead-of-schedule tasks.
- Resources: Evaluate how your team is performing by checking who is assigned to what task, and how much they've completed.
| Status | Interpretation |
|---|---|
| On track | The project is going according to plan |
| At risk | Some tasks are behind schedule and need attention |
| Off track | The project is in danger of not meeting the deadlines or objectives |
2. What features or tools are available for tracking progress on a client project dashboard?
Essential Tools and Features for Tracking Progress
Several indispensable features have become a mainstay for tracking progress on a client project dashboard, each uniquely tailored to make the tracking process easier, more efficient, and more transparent. Among these features include:
- Gantt Charts - These offer a visual timeline for the project, displaying the duration and the progression of each task.
- Status Tracking - This allows you to immediately identify which tasks are complete, in progress, or pending.
- Milestone Tracking - Milestones act as significant markers in the project timeline, representing critical goals to reach.
- Collaboration Tools - These enable multiple individuals to work together, facilitating communication and cooperation.
Beyond these fundamental tools, some advanced features also provide valuable insights into the project’s progression.
Advanced Features for Progress Tracking
More sophisticated dashboards might offer tools for analyzing data or automating certain components of progress tracking. Here are examples of these advanced features:
| Advanced Feature | Description |
|---|---|
| KPI Monitoring | Monitors key performance indicators to measure project performance relative to its goals |
| Risk Management Tools | Helps in predicting potential project risks and finding solutions |
| Automated Reporting | Generates automated project reports to track and present complex project information effortlessly |
| Forecasting Tools | Projects future developments based on historical data |
These tools offer a higher degree of control and predictability, enabling project managers to navigate projects more accurately and purposefully.
3. Is there a way to see a percentage of overall completion on the project in the dashboard?
Using Progress Percentage in Client Project Dashboard
A useful feature of most client project dashboards is the ability to view the percentage of overall completion. This is a great way to visually capture progress, manage project resources, and anticipate project completion time. This percentage is usually calculated based on the ratio of tasks completed to total tasks.
- First, ensure that all tasks within the project are clearly defined and tracked within the dashboard.
- Second, each time a task is completed, it should be marked as such within the software.
- Lastly, the dashboard will auto-calculate the percentage completion, providing a real-time, at-a-glance overview of progress.
Interpreting the Progress Percentage
The percentage of completion can be presented in various formats for easy understanding. It could be in a simple numerical representation, a progress bar, or even a pie chart. Let’s consider an example:
| Task | Status | Percentage Completion |
|---|---|---|
| Task 1 | Completed | 25% |
| Task 2 | In progress | 50% |
| Task 3 | Not started | 0% |
Benefits of Tracking Progress Percentage
Tracking project progress in terms of percentage offers several key advantages:
- Efficient Planning: By knowing the percentage of work completed, management can adequately plan and distribute the remaining tasks and resources.
- Better Communication: Clients and stakeholders can be kept updated with transparent, measurable progress.
- Risks Mitigation: Any delay or issue can be easily identified and mitigating steps can be taken immediately.
4. Can I set up alerts or notifications related to project progress on my client project dashboard?
Setting Up Alerts or Notifications
With most Client Project Dashboard, you always have the option to set up alerts or notifications related to project progress. These alerts can keep you updated on critical milestones, deadlines, task completions, and also give you a proactive warning if your project may be veering off track. This takes away the need to constantly monitor the dashboard and ensures you never miss out on any significant updates.
Steps to Set Up Alerts
The following are the general steps you can take to set up notifications:
- Select the project you wish to monitor.
- Navigate to the settings section of the dashboard.
- Look for the option titled "notifications" or "alerts".
- Choose the type of notifications you wish to receive. These can often include email, SMS, or in-app notifications. You can pick one or multiple mediums based on your preference.
- Select the events for which you want to receive notifications. This could include project milestones, task completion, task assignments, warnings, etc.
- Save your changes.
Example of Dashboard Notification Setup
| Steps | Description |
|---|---|
| Select Project | Choose the specific project for alerts. |
| Navigate to Settings | Proceed to the dashboard settings. |
| Select "Notifications" | Locate and click the notifications or alerts tab. |
| Choose Notification Type | Select your preferred form of notification. |
| Select Trigger Events | Choose the events that will trigger notifications. |
| Save Changes | Ensure to save all your preferred changes. |
This system of setting up notifications keeps you informed about project progress even when you are not actively viewing the project dashboard. This increased awareness of project activities helps in capturing any potential issues much earlier, thereby improving overall project management efficiency.
5. Can I customize my client project dashboard to focus on specific metrics or KPIs?
Customizing Your Client Project Dashboard for Specific Metrics or KPIs
Yes, a client project dashboard can be customized to focus on specific metrics or Key Performance Indicators (KPIs). This flexibility allows for better productivity, enabling visibility to crucial data for performance assessment and decision-making. Here's how you can do it:
- Identify KPIs: The first step is to identify the metrics essential to your project. It can be delivery timelines, budget consumed, project scope, or team performance, among others. These KPIs will act as your guiding points.
- Create Custom Fields: After you've determined your KPIs, most dashboards allow creating custom fields to reflect these metrics specifically. It can go a long way in tailoring your dashboard according to your project needs.
- Build Visualizations: Visual elements like charts, graphs or progress bars can be useful to picturize your project performance. Dashboard customization often includes several built-in tools for creating such visualization.
Dashboard Customization Example
To illustrate, consider a project management scenario where timeline adherence, resource utilization and task completion are the main KPIs. You could create a custom dashboard as follows:
| Dashboard Section | Custom Field | Visualization |
|---|---|---|
| Timeline Adherence | Planned vs Actual Dates | Gantt chart |
| Resource Utilization | % of Resource Utilization | Bar Graph |
| Task Completion | Completed vs Pending Tasks | Progress Bar |
Thus, with a specifically tailored dashboard, you get to focus on what is truly important for your project success.
6. How can I share the progress from the client project dashboard with my team or with the client?
Sharing Progress with Your Team
If you are leading a project, sharing progress from the client project dashboard with your team is simple and can be completed through a variety of methods. These methods include:
- Email Reports: Most project management software can generate an automated report based on the real-time data. You can schedule these reports to be sent to the entire project team on a regular basis.
- Software Sharing Features: If your team also has access to the software, you can utilize the built-in sharing features. Some of these features could include screen sharing, live progress updates, or a team notification system.
- Data Export: If needed, most project dashboards will also allow you to export the progress data into a format (like CSV or XLSX) that can be easily shared and viewed by the team.
Sharing Progress with the Client
Sharing progress with the client is a delicate process that needs careful consideration. It is not necessary to share every single detail; however, keeping them updated about the overall progress and milestones achieved is crucial. Here's how you can do it:
- Email Updates: Depending on the agreement with the client, email updates could be on a weekly or monthly basis. The key is to summarize your progress, stating the tasks completed, milestones reached, and highlighting any important issues or changes.
- Client Portals: Some project management software offers client portals where clients can log-in and check the progress in real-time. client portals also allow clients to access key documents and project reports.
- Meetings and Calls: While you can certainly share some aspects of the client project dashboard during a call or meeting, it's effective to walk clients through the dashboard once, showing them how they can check the project's progress on their own.
Example of a Summary Email
Below is an example of how you can share progress updates through an email:
| Subject: | Weekly Project Update |
|---|---|
| Body: | Dear [Client's Name], This week, our team has completed tasks A, B, and C. We have also achieved major milestone X. For additional details or to check the progress in real-time, please check the client portal link [provide link here]. Best, [Your Name] |
7. Can I track the time spent by each team member on tasks within the client project dashboard?
Tracking Time Spent on Tasks within the Client Project Dashboard
In most modern project management systems, tracking the time that each team member spends on their assigned tasks is a standard feature. A comprehensive client project dashboard should have the ability to record the time your team members spend on various tasks. This functionality is critical for effective time management, balancing workloads, understanding cost implications, and for client billing purposes. It also provides transparency to clients about how the project hours are being used.
How to Track Time Spent
To capture the time spent by each team member, follow the steps below:
- Assign each task to a specific team member within the dashboard.
- Ensure that the dashboard features a time-tracking tool or is compatible with a third-party time tracking software.
- Gather team members to turn on the time-tracker when they begin a task and turn it off when they finish.
- Accumulate this data frequently (daily is best) for accuracy and analysis.
Visualizing Time Spent
Once the time has been captured, it can be visualized in numerous ways within the client project dashboard. For example:
| Visualization Type | Description |
|---|---|
| Bar Graph | Each task is represented by a bar, with the length of the bar indicating the time spent on the task. |
| Pie Chart | The whole chart represents the total time spent on the project, and each task is represented by a slice of the pie, the size of which indicates the time spent on that task. |
| Heat Map | Tasks are represented by blocks, and the colour intensity of each block indicates the time spent on the task. The darker the block, the more time spent. |
This enable project managers to easily identify time-draining tasks and adjust resources accordingly.
8. What's the best way to represent progress over time in my dashboard?
Choosing the Best Representation Method
To effectively display progress over time in your project dashboard, you need to choose a representation method that clearly conveys the information. Line graphs, bar charts, and Gantt charts are among the most commonly used graphics for such purposes. These visual representational tools serve different purposes and can provide unique insights into your project's progress.
- Line Graphs: These are excellent for showcasing trends, thus ideal for tracking variables that change over time, such as project completion percentage or budget expenditure.
- Bar Charts: Use these when comparing different data sets or to show duration. For example, you could display the number of hours spent on each project task.
- Gantt Charts: These are specialized timelines that illustrate the start and finish dates of different project components. They're perfect for tracking overall project timelines and dependencies between tasks.
Crafting a Visual Impact
To make your reports more intuitive, always opt to create a combination of these chart types in your dashboard. It’s essential to use colours, sizes, and labels effectively to increase readability and the ability to draw insights quickly. Also, keep your dashboard uncluttered by only showing the most critical data or metrics that reflect the progress over time.
Data in Tabular Format
While visual representations are instrumental in delivering immediate insights, they must be supplemented with data in tabular formats for more nuanced understanding. Tables are particularly useful to present raw numbers and when you need to provide precise details.
| Task | Start Date | End Date |
|---|---|---|
| Task 1 | Jan 1, 2022 | Jan 7, 2022 |
| Task 2 | Jan 8, 2022 | Jan 14, 2022 |
9. Can the client project dashboard provide real-time updates about project progress?
Real-time Updates in Client Project Dashboard
Yes, a client project dashboard can certainly provide real-time updates about the project’s progress. Real-time updates are crucial to maintaining thorough oversight of the project's status. With live updates, any changes in the project, be it task completion, resource allocation, or deadline adjustments, are instantly reflected on the dashboard. This gives a continual, up-to-date view of the project.
Features Supporting Real-Time updates
Here are some of the features that support real-time updates:
- Dynamic Data Visualization: The dashboard should be able to visually depict the progress of various tasks in real-time. Graphics like pie-charts and bar graphs update as progress is made, allowing stakeholders to see at a glance the current state of the project.
- Automated Update Mechanism: Updates should be automatic, so everyone can track the project's status. Any changes entered into the system by any team member should show up on the dashboard immediately.
- Integration Capabilities: The dashboard should be able to integrate with other project management tools, which allows data synchronization across platforms and real-time updates.
Data Displayed in Real-Time
The following data can be displayed in real-time on a client project dashboard:
| Data | Description |
|---|---|
| Task Status | Provides information on what tasks are completed, ongoing, or pending. |
| Project Milestones | Indicates the key phases of the project and their completion status. |
| Resource Allocation | Shows how resources are being utilized throughout the project. |
| Timeline and Deadlines | Offers an up-to-date view of the project's timeline, showing any shifts in deadlines. |
10. How can I solve issues or bottlenecks detected through the client project dashboard?
Solving Issues Detected through the Client Project Dashboard
Once you've identified issues or bottlenecks using the client project dashboard, it's necessary to devise an effective strategy to resolve them. Here are some strategies you might find helpful:
- Allocate Resources Appropriately: If the dashboard indicates that a certain task or aspect of the project is taking longer than anticipated, you might need to allocate extra resources or manpower to that area.
- Realign Project Goals: Sometimes, the issue might be with your overall strategy or goals. Take a look at the overall project scope and reassess what can be realistically achieved.
- Improve Communication: Often, bottlenecks occur due to a lack of effective communication among team members. Utilize the communication features in your dashboard to improve collaboration.
Using the Dashboard to Monitor Progress
The following table summarises how different dashboard features might signal the need for intervention:
| Dashboard Feature | Possible Issue | Suggested Solution |
|---|---|---|
| Task Completion Time | Tasks are taking longer than expected | Allocate additional resources or reassess project scope |
| Team Communication | Lack of effective collaboration | Enhance use of communication features |
Escalating and Resolving Issues
If the issues detected cannot be resolved within the project team, it may be necessary to escalate them. Most project dashboards come with features that allow you to raise issues promptly. You can tag the relevant stakeholders, elaborate on the issue, and propose potential solutions. It helps to keep everyone informed and fosters a solution-oriented approach to project management. Regularly review the dashboard to monitor if these issues are resolved and make necessary adjustments to your project strategy based on the feedback.
Conclusion
Track Progress with Your Client Project Dashboard
Project tracking is an essential part of any project management. It ensures that projects are completed within the deadline and budget and that they meet the client's needs. You can make project tracking easier, more effective, and more efficient by using a client project dashboard. This is a tool that allows you to visualize every aspect of a project so that you can monitor its progress and performance in real-time.
Why Use a Project Dashboard?
Project dashboards are helpful for keeping clients updated on progress, resolving issues quickly, and aligning project goals with client expectations. They allow you to see, at a glance, the health of the project, including its status, timeline, budget, and more.
Introducing Retainr.io
One such software that offers an efficient project dashboard is Retainr.io. It's a whitelabel software that helps businesses sell, manage clients, orders, and payments through their own branded app.
Advantages of Using Retainr.io
Retainr.io allows you to track the progress of all your projects in one place. You can see the status of each task, who is working on them, and when they are due. It also helps keep your budget under control, by providing financial overviews and budget tracking features. Plus, you can tailor the dashboard to suit your needs or those of your clients.
How to Use The Retainr.io Dashboard
To start tracking your project progress, you simply need to set up your tasks in the Retainr.io dashboard. Then you add your team members, assign tasks, set deadlines, and monitor progress. The intuitive interface makes it easy to keep track of all your project details in one location.
Try Retainr.io today to enhance the way you track progress on your client project dashboard, delivering better and more efficient results.
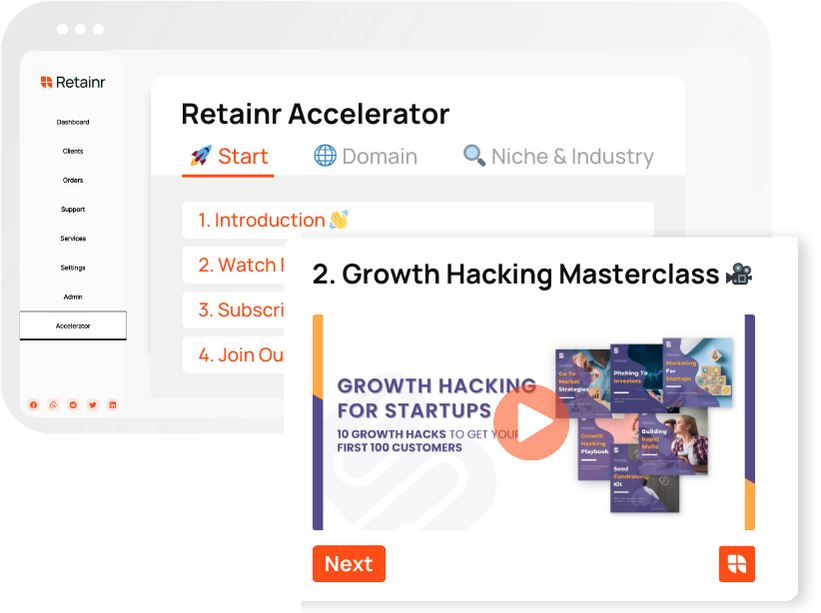
Boost Your Agency Growth
with Retainr Accelerator
Uncover secrets, strategies, and exclusive blueprints to take your agency's growth to the next level — from marketing insights to effective presentations and leveraging technology.
SOPs, Cheatsheets & Blueprints
Leverage 50+ SOPs (valued over $10K) offering practical guides, scripts, tools, hacks, templates, and cheat sheets to fast-track your startup's growth.
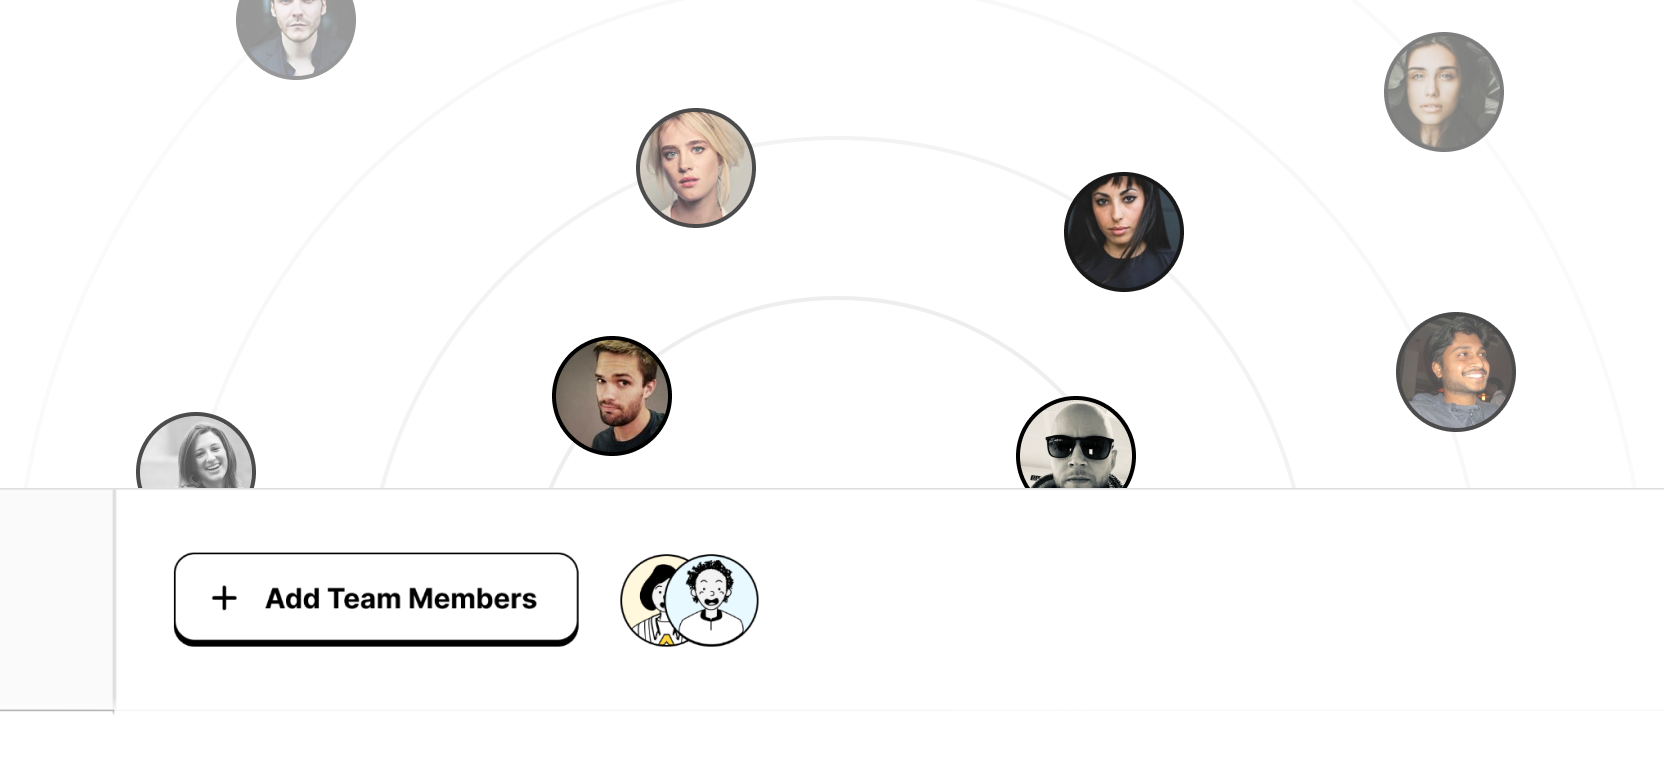
Connect with fellow entrepreneurs, share experiences, and get expert insights within our exclusive Facebook community.
.jpg)
Join a thriving community of growth hackers. Network, collaborate, and learn from like-minded entrepreneurs on a lifelong journey to success.
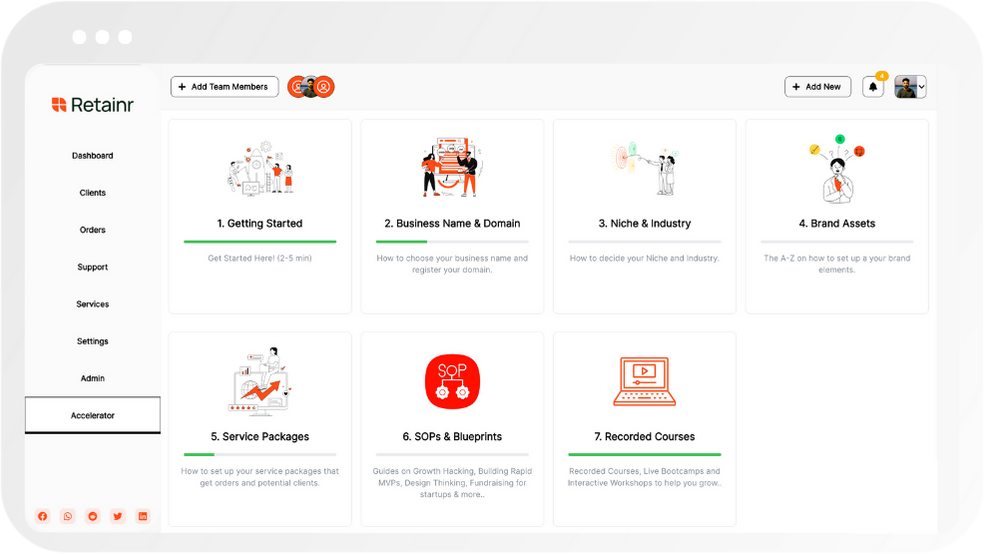
Gain expertise with recorded Courses, Live Bootcamps and interactive Workshops on topics like growth hacking, copywriting, no-code funnel building, performance marketing and more, taught by seasoned coaches & industry experts.

.jpeg)


